
Australia’s home prices increased in May, with Sydney and Perth leading the growth over the month.
PropTrack’s latest Home Price Index showed a 0.33% increase in home prices across the country, bringing prices up 1.55% from the low point recorded in December 2022.
Over the three-month period to May, home prices in the combined capital cities have risen 1.34% in the past three months, the strongest quarterly growth since the December quarter of 2021.
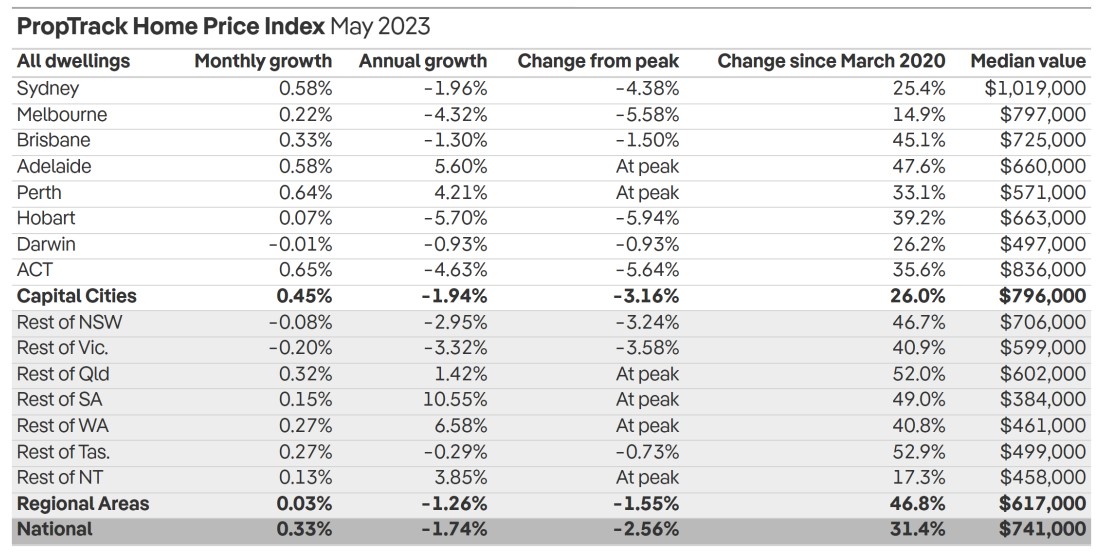
PropTrack senior economist Eleanor Creagh said gains became widespread in May, with every capital city except Darwin recording increases.
“Canberra and Hobart joined the rebound as their recent falls reversed. Meanwhile, all regional markets saw prices rise in May except regional NSW and regional Victoria,” she said.
One trend worth noting is the superior performance of capital cities relative to their regional counterparts on monthly terms. On annual basis, however, regional markets reported higher growth rates than capital cities.
Ms Creagh said the decision of the Reserve Bank of Australia to lift the cash rate in May has not deterred the current home price rebound, and this could be driven by the limited supply and rising demand.
“Supply constraints have eased slightly with respect to total stock for sale, but the flow of new listings remains soft. This is keeping a floor under prices, with sellers benefitting from less competition with other vendors,” she said.
“Market conditions have improved following five consecutive months of price growth, driven by stronger housing demand relative to stock on market.”
Ms Creagh said auction activity it is also interesting to note that auction activity has improved, and clearance rates remain firm after rising above levels seen in the second half of 2022, at a time when interest rates were rising rapidly and prices were falling in most markets.
“Although they are at or close to peak levels, interest rates may still rise further and the economy is also expected to slow — these factors may weigh on home prices in the months ahead,” she said.
“However, the continued tightness in the labour market, stronger housing demand and the limited supply environment are likely to support an ongoing recovery.”
Buying a home or looking to refinance? The table below features home loans with some of the lowest interest rates on the market for owner occupiers.
| Lender | Home Loan | Interest Rate | Comparison Rate* | Monthly Repayment | Repayment type | Rate Type | Offset | Redraw | Ongoing Fees | Upfront Fees | Max LVR | Lump Sum Repayment | Extra Repayments | Split Loan Option | Tags | Features | Link | Compare | Promoted Product | Disclosure |
|---|---|---|---|---|---|---|---|---|---|---|---|---|---|---|---|---|---|---|---|---|
5.94% p.a. | 5.98% p.a. | $2,978 | Principal & Interest | Variable | $0 | $530 | 90% |
| Promoted | Disclosure | ||||||||||
5.89% p.a. | 5.80% p.a. | $2,962 | Principal & Interest | Variable | $0 | $0 | 80% |
| Promoted | Disclosure | ||||||||||
6.04% p.a. | 6.08% p.a. | $3,011 | Principal & Interest | Variable | $0 | $530 | 90% |
| Promoted | Disclosure |


-
Photo by Harlz on Canva.
Collections: Mortgage News Property News

Share