

If there was a change in Australia's housing market for the past month, it would be that the rate at which prices were falling seemed to have already slowed. The catch, however, is that the housing downturn has become more geographically widespread, CoreLogic head of research Tim Lawless said.
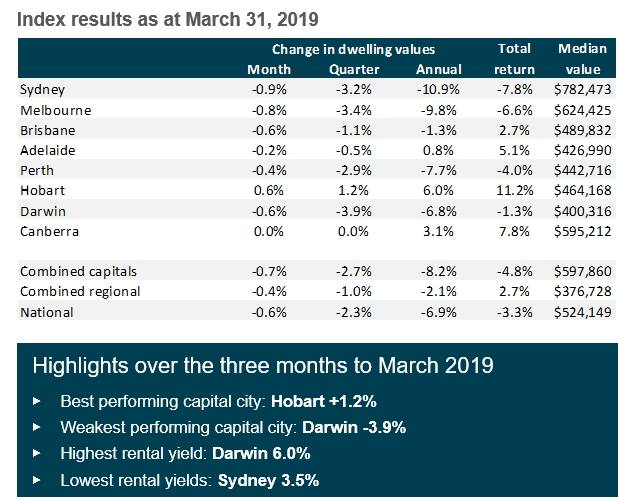
National house prices recorded a month-on-month decline of 0.6% in March, the smallest rate of monthly decline since October last year.
“While the pace of falls has slowed in March, the scope of the downturn has become more geographically widespread," Lawless said.
All capital cities, save Hobart and Canberra, registered declines, with Sydney posting the most significant price fall at 0.9%. Hobart was the only capital city to record a growth in value at 0.6% while prices in Canberra stayed flat.
Also Read: Here are the best regional areas for first-home buyers
On a quarterly basis, Darwin witnessed the biggest housing decline at 3.9%, followed by Melbourne (3.4%), Sydney (3.2%), Perth (2.9%), and Brisbane (1.1%). Prices in Canberra were also flat on quarter-on-quarter terms while Hobart recorded a 1.2% gain.
Sydney registered the largest annual decline of 10.9%, the only capital city to record a double-digit fall. Melbourne followed with 9.8%.
Australia's regional housing markets have also started to show signs of weakness. In fact, values in regional areas outside Sydney have declined by 3.6% over the past year while regional Queensland witnessed a 1.6% decline.
Regional Western Australia suffered the biggest price decline as its dwelling values fall by as much as 9.5% over the year. For the past five years, values in the area have already amassed a cumulative decline of 25.8%.
"The silver lining here is that housing is now very affordable and first home buyers are proportionally much more active relative to other areas of the country," Lawless said.
The table below shows how each capital city performed over March.
Collections: Mortgage News

Share