

There are major shifts in demand across Australian housing markets for the past six months due to the impacts of the COVID-19 outbreak. This has led to some areas experiencing a slowdown in market activity, which opens up an opportunity for buyers to take control of the negotiating table.
The median days-on-market measure is a good indicator of changes in demand, according to a study by CoreLogic. When the market is slowing, the said measure rises, providing buyers with bargaining power.
Over the three months to September, the median number of days for a typical dwelling in Australia to get sold was 45, according to CoreLogic. While this was already an improvement from the June quarter, it was still higher than the level recorded pre-COVID-19. This suggests that demand continues to be subdued.
A trend can be derived from looking at the changes in the days-on-market in capital cities and regional markets amid the pandemic.
CoreLogic data show that across combined capital cities, a typical dwelling stayed on the market for just 30 days in April. This reflects the strong market conditions prior to the outbreak. This number has increased to 44 days in the three months to July, only to ease to 40 days by September.
On the contrary, regional markets had a lower days-on-market amid the pandemic than it did prior. Over the three months to September, dwellings in regional markets spent 57 days on the market before gettting sold. This is lower than the 59 days-on-market during the first quarter of the year.
The days-on-market measure across capital cities and regional markets can provide information as to where buyers have a greater bargaining power.
Which areas give buyers the bargaining power?
Days-on-market increased from 26 to 36 in Sydney and declined by 65 to 57 in regional New South Wales. Over the September quarter, properties took longer time to sell in the markets of Parkes LGA Region, Canterbury-Bankstown LGA, and Lane Cove LGA.
The restrictions imposed in Melbourne over the recent months have affected the overall days-on-market of properties not just in the city. However, the typical days-on-market measure in Melbourne is starting to ease, indicating that a return to a seller's market. Still, properties in the city spent 36 days on the market, still high than the pre-COVID-19 levels of 30 days.
Perth appears to be shifting from a buyer's market to a seller's one. Despite the impacts of the pandemic, activity in the city was quick to recover, as sales volume rose and new listings increased. In fact, the days-on-market in Perth during the September quarter is 40, lower than the five-year average of 52.
Hobart has the lowest days-on-market of all capital cities. Prior to COVID-19, a typical dwelling in Hobart spent only nine days in the market. This, however, increased to 27 days over the past three months.
On the other hand, Darwin remains to be the biggest buyer's market. It had the highest median days-on-market in three months to September among capital cities at 56. This however, was alreaady an improvement from the 72 days during the first three months of the year.
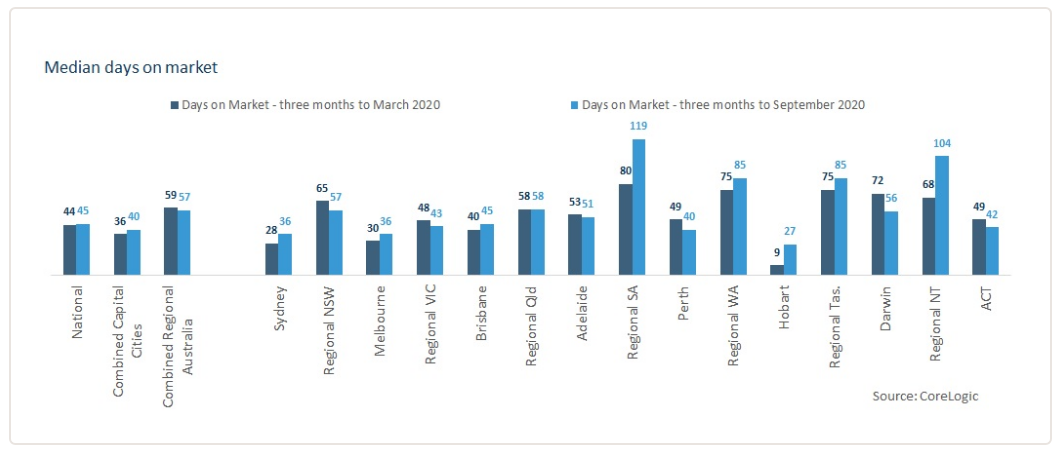
The CoreLogic graph below shows the changes in the days-on-market in each major housing markets from the March quarter to the three months to September:
Collections: Mortgage News

Share