

The sharp surge in prices across most housing markets in Australia in the past decade has made it a struggle for many first-home buyers to enter the market — tides have changed, however, and it seems like Australia's average housing affordability is at best it has been since 2016, a new report shows.
The ANZ-CoreLogic Housing Affordability report analysed four factors to determine how affordable the housing market has become: value-to-income ratio, share of income required for repayments, years to save a deposit, and rent to income ratio.
The study found that housing affordability improved across the country in the last quarter of 2018 — however, the development was being driven by falling values rather than a substantial lift in wages.
It's getting easy to service a loan
As at December 2018, the repayment on a new 80% LVR mortgage required 36.1% of gross household income, the lowest share since December 2016.
At the peak of rates in March 2008, Australian households with new mortgages had to allocate 54.2% of their income to meet mortgage repayments.
"The reduction in servicing can be attributed to the fact that mortgage rates have almost halved from their peak, from 8.7% in March 2008 to 4.7% in December 2018," the study said.
Time needed to save for deposit shortens
The study also found that the years required to save for a deposit decreased, albeit only slightly, from 9.1 years to 8.9 years. This is based on households saving 15% of their gross annual income for the 20% home-loan deposit requirement.
However, compared to the time needed for households to meet the deposit requirement five and 10 years ago, there are still significant gaps. With detached homes generally being more expensive, the length of time to save a deposit for a house was 9.2 years in December 2018 and 8.7 years for a unit.
"To put that cost into perspective, five years ago it took 8.6 years for a house and 8.3 years for a unit while a decade ago it took 8.7 years and 7.8 years respectively," the study said.
Values fall, income grows
The study measured the value-to-income ratio at 6.7% in the December quarter last year, down from 6.8% in the previous three months and from 7% during the previous year.
"The ratio of house values to household incomes was recorded at 6.9 times, down from the previous quarter and year. As dwelling values trend lower, the median value to household income ratio is falling and we would expect further improvements to the dwelling value to income ratio over the coming quarters," the study said.
Renting remains cheaper than buying
Another significant finding is the improvement in rent-to-income ratio. Renting houses in Australia require 28.2% of gross household income, while renting a unit takes a slightly higher share at 28.4%. These results mean paying rent remained cheaper that repaying a mortgage.
According to the study, rents required less than 32% of household income even at their peak. This is due to the low rate of rental price appreciation, with rents rising by only around 2.4% annually over the past decade. On the other hand, incomes have tracked 3.2% higher per annum over the same time frame.
"The stronger income growth relative to rents has pushed the national rent to income ratio to its lowest level since June 2007," the study said.
Where the most affordable housing markets are
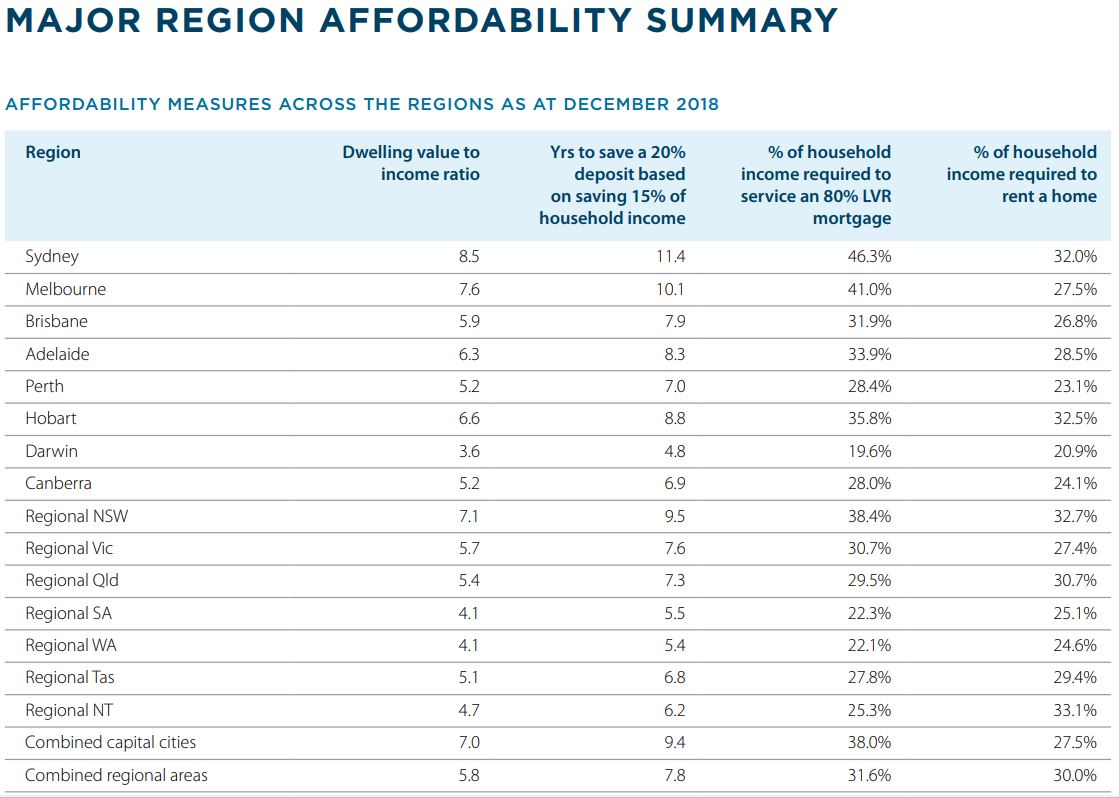
In regional terms, Hobart became the most expensive capital city for renters, while Darwin became the most affordable for buyers. Despite the strong price declines recorded in Sydney and Melbourne over the past year, they are still the least affordable market to purchase a dwelling in.
The table below shows the affordability measures across capital cities and regional areas in Australia:
Collections: Mortgage News

Share