

National property listings decreased by 5.8% in June, driven by the significant declines in Sydney and Melbourne, the latest figures from SQM Research show.
All capital cities reported a slump in property sales listings over the month, with Sydney and Melbourne recording falls of 10.8% and 10.7%, respectively. Overall, there were only 325,404 property listings in the month.
On a yearly basis, listings decreased by 1.8%, with Sydney reporting the most significant annual decline at 9.8%.
"It is not unusual for listings to decrease in June, the start of the colder winter months. Also, with falling house prices in recent months, most vendors have preferred to wait and watch," SQM Research CEO Louis Christopher said.
The table below shows the property listings growths and declines in each capital city.

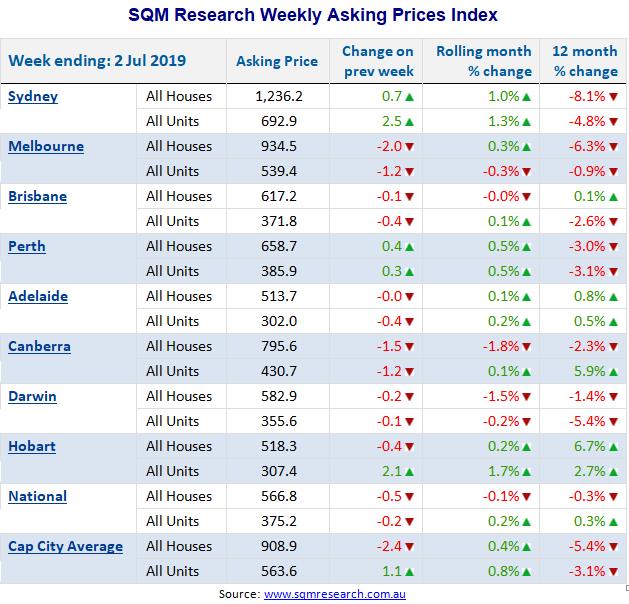
Asking prices edge up
Overall, asking prices in capital cities increased marginally by 0.4% to $908,900 for houses and 0.8% to $563,600 for units. Of all the cities, Darwin was the only one to record declines in asking prices.
After two years of subdued market, Sydney seemed to have made a modest turnaround, posting an improvement in asking prices for units (1.3%) and houses (1%).
The marginal increase in asking prices could be attributed to several factors, Christopher said.
"The modest rise in asking prices in most cities could be a result of reduced stock levels and also increasing buyer confidence due to multiple factors including the Coalition victory, the RBA cash rate cut in June and the relaxation of mortgage lending rules by APRA," he said. "With further RBA rate cuts expected, we could see increases in property listings in the coming months."
The table below shows the changes to the asking prices in capital cities.
Collections: Mortgage News

Share