

Australia’s housing market recovery appears to be accelerating, as reflected in the performance of capital cities over the June quarter.
According to Domain’s House Price Report for June 2023, the combined capital house prices increased nearly four times faster than the previous quarter, resulting in the most significant gain since late 2021.
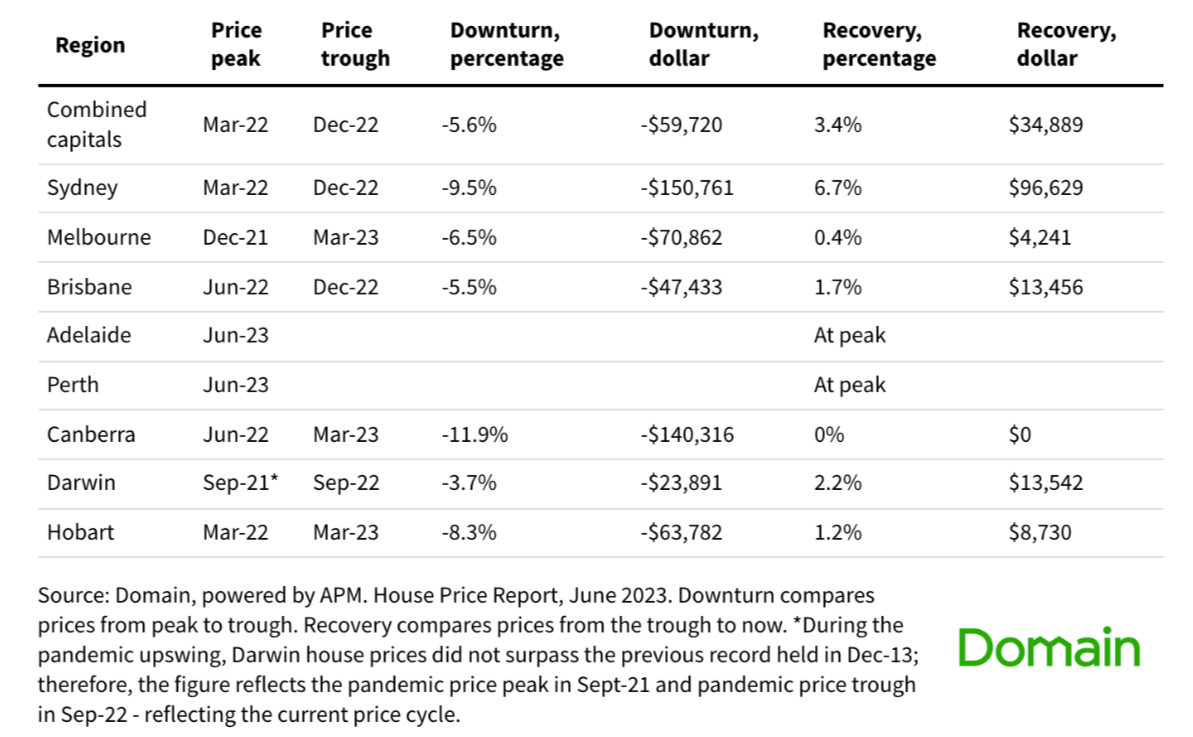
Over the quarter, capital cities were able to recoup around $35,000 of the $60,000 in value lost during the 2022 downturn.
Interestingly, Sydney continues to lead the recovery and witnessed the most substantial gain — the city was already two-thirds into recovery.
However, Adelaide and Perth were the standouts during the quarter after reaching their market peak.
Domain chief of research Dr Nicola Powell said the ongoing imbalance between supply and demand has been a key factor driving the current price recovery observed in the Australian housing market.
“This has been fuelled by an unseasonably weak flow of new listings and rising demand — with the total number of homes for sale 22% below the five-year average for the combined capitals,” she said.
Here are the capital city highlights over the quarter:
- Sydney: House prices surged four times faster than the previous quarter, and unit prices gained momentum, experiencing the strongest quarterly gain in two years.
- Melbourne: Housing market recovery resumed, with both house and unit prices increasing in the June quarter after previous declines.
- Brisbane: House prices continued their recovery, with the steepest quarterly gain in a year. Unit prices reached a record high, outperforming house prices for five consecutive quarters, narrowing the price gap between property types to a two-year low.
- Adelaide: House prices reached a new record high, surpassing $800,000 for the first time. The strongest quarterly gain since early 2022 was observed. Adelaide's unit market showed remarkable growth, recording the steepest quarterly surge since 2007, reversing the previous quarter's decline.
- Canberra: Housing market stability returned as house prices flatlined, achieving the best quarterly outcome in a year. However, house prices experienced the steepest annual decline the city has ever seen. Unit prices declined over the June quarter, with Melbourne overtaking Canberra as the second most expensive capital city to purchase a unit.
- Perth: House prices reached an all-time high, but unit prices declined over the quarter, leading to the steepest annual decline in three-and-a-half years. Perth holds the record price gap between property types, with house prices outperforming unit prices for nine consecutive quarters.
- Hobart: The housing market rebounded, with house prices increasing over the June quarter, following four consecutive quarters of decline. However, unit prices declined over the quarter, remaining modestly lower than a year ago.
- Darwin: House prices increased over the June quarter, regaining most of the previous quarter's loss. Darwin retains its position as Australia's most affordable city to purchase a house. Unit prices held steady but experienced the steepest annual decline in just over three years.
Dr Powell said there could be a slowdown in price growth as listings continue to rise, which will provide opportunities to those looking to enter the market.
“The tide is gradually changing, as the flow of new listings improves, likely spurred by the persistent pricing recovery or homeowners selling due to the higher debt costs,” she said.
“Some cities are seeing an improvement — in Sydney, Melbourne, Canberra and Darwin, new listings are higher than their five-year average.”
Buying a home or looking to refinance? The table below features home loans with some of the lowest interest rates on the market for owner occupiers.
| Lender | Home Loan | Interest Rate | Comparison Rate* | Monthly Repayment | Repayment type | Rate Type | Offset | Redraw | Ongoing Fees | Upfront Fees | Max LVR | Lump Sum Repayment | Extra Repayments | Split Loan Option | Tags | Features | Link | Compare | Promoted Product | Disclosure |
|---|---|---|---|---|---|---|---|---|---|---|---|---|---|---|---|---|---|---|---|---|
5.94% p.a. | 5.98% p.a. | $2,978 | Principal & Interest | Variable | $0 | $530 | 90% |
| Promoted | Disclosure | ||||||||||
5.89% p.a. | 5.80% p.a. | $2,962 | Principal & Interest | Variable | $0 | $0 | 80% |
| Promoted | Disclosure | ||||||||||
6.04% p.a. | 6.08% p.a. | $3,011 | Principal & Interest | Variable | $0 | $530 | 90% |
| Promoted | Disclosure |


-
Photo by najkhetsamtip on Canva.
Collections: Mortgage News Property News

Share