
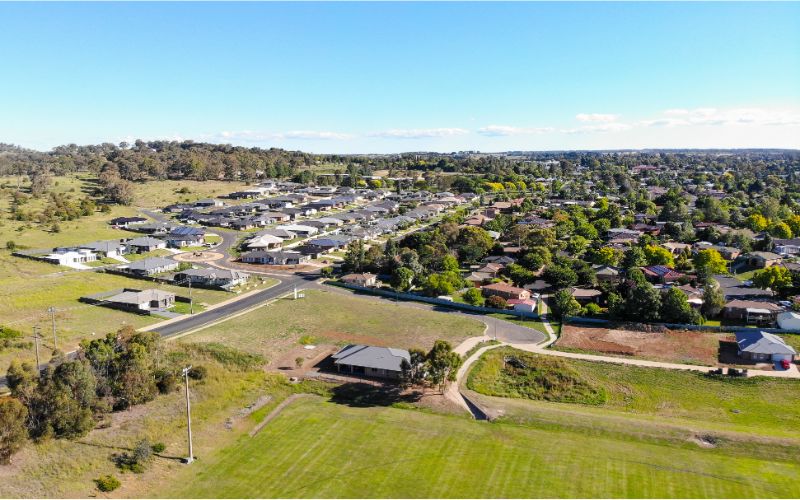
While the housing markets continue to recover, it appears regional markets are lagging behind, especially when compared with how they performed last year.
CoreLogic’s latest Regional Market Update showed that despite regional Australian dwelling values rising for the past five months, median house values remain 5.6% below this time last year, and sales volumes are down 21.3%.
CoreLogic Australia head of research Eliza Owen said the overall growth in housing markets are being led by capital cities and reflect milder housing demand across regional Australia as demographic patterns normalise.
“Year-on-year growth was hard to find across regional Australia in the past 12 months — the markets that saw an increase were largely more affordable and were more rural. Presumably, lower value assets have been more resilient to increases in interest costs because they require lower indebtedness,” she said.
“Additionally, targeted migration programs also tend to focus on parts of regional Australia as a pathway to permanent residence, so some of the more rural, regional parts of the country may have seen sustained housing demand as international travel restrictions have lifted through 2022.”
Of the 25 largest non-capital city regions monitored by CoreLogic, only seven markets reported gains in median house prices and only five reported growth in median unit prices. Here are the highlights of the latest CoreLogic Regional Market Update:
- Houses in the South East region of South Australia — which includes tourism hotspots Kangaroo Island, the Fleurieu Peninsula, and the Limestone Coast — had the largest annual growth for the fourth consecutive report, up 9.1% in the year to July.
- Queensland was the big winner over the period, with Central Queensland (2.7%), neighbouring Mackay–Isaac–Whitsunday (1.2%), Toowoomba (0.7%), and Cairns (0.5%) reporting gains.
- The weakest conditions over the past year persisted in NSW lifestyle markets Richmond-Tweed (-20.4%) and Southern Highlands and Shoalhaven (-15.0%), although the annual pace of declines is easing.
- Victoria’s Ballarat and Geelong also posted double-digit declines in house values.
- Across the unit markets, five markets posted gains, led by NSW’s Riverina region for the second consecutive time with 18.7% growth, followed by Cairns (9.2%) and Hume, Victoria (9.1%).
- Launceston and North East (Tasmania) and Richmond-Tweed recorded the equal largest decline in unit values over the past year of -11.4%.
- Unit sales volumes declined in all regions over the year to May.
Ms Owen said the easiest indicator for the outlook of regional markets is the price point.
“The higher the value of the market, the more likely it’s seen poorer performance in the past year — but the good news for sellers is that these markets appear to have passed through the depths of the downswing,” she said.
“While there’s still a few headwinds on the horizon for housing market performance more broadly, popular high-end markets could start to stabilise as mortgage rates move closer to a peak, and capital city markets become more expensive.”
Buying a home or looking to refinance? The table below features home loans with some of the lowest interest rates on the market for owner occupiers.
| Lender | Home Loan | Interest Rate | Comparison Rate* | Monthly Repayment | Repayment type | Rate Type | Offset | Redraw | Ongoing Fees | Upfront Fees | Max LVR | Lump Sum Repayment | Extra Repayments | Split Loan Option | Tags | Features | Link | Compare | Promoted Product | Disclosure |
|---|---|---|---|---|---|---|---|---|---|---|---|---|---|---|---|---|---|---|---|---|
5.94% p.a. | 5.98% p.a. | $2,978 | Principal & Interest | Variable | $0 | $530 | 90% |
| Promoted | Disclosure | ||||||||||
5.89% p.a. | 5.80% p.a. | $2,962 | Principal & Interest | Variable | $0 | $0 | 80% |
| Promoted | Disclosure | ||||||||||
6.04% p.a. | 6.08% p.a. | $3,011 | Principal & Interest | Variable | $0 | $530 | 90% |
| Promoted | Disclosure |


-
Photo by Cookie679 on Canva.
Collections: Mortgage News Property News

Share